Dashboard chart
Googl Search Results overview
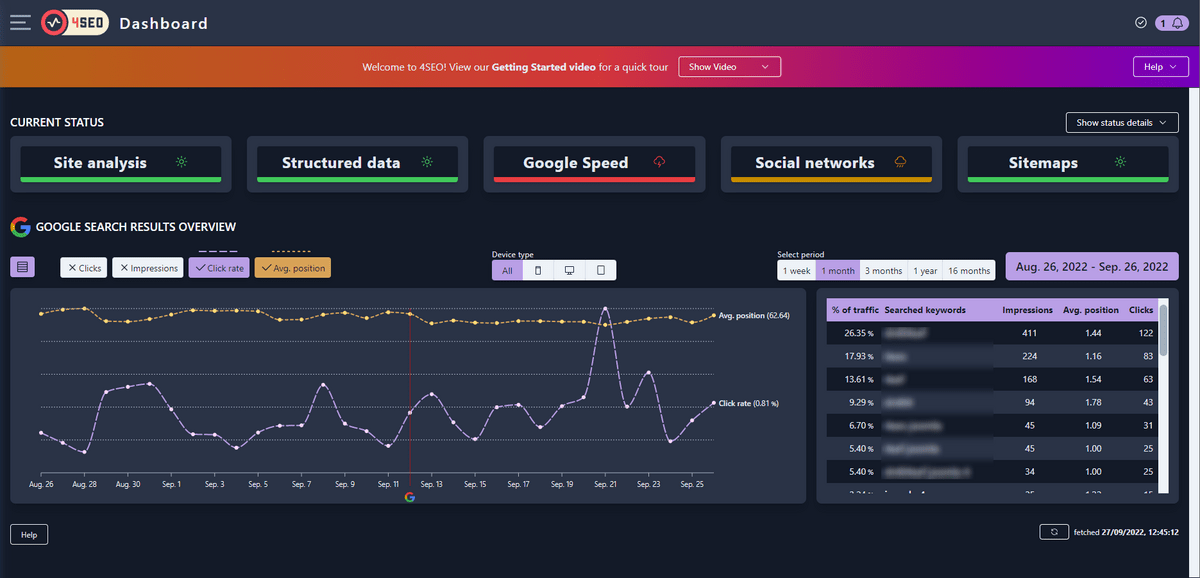
The dashboard overview is made of 2 pieces: the Search Results performance chart and the Keywords overview.
The dashboard overview chart
This is an interactive chart displayed automatically on your 4SEO control panel home whenever you have configured 4SEO integration with your Google Search Console account.
It gives you a rapid overview of how your website performs in Google search results, over a period of time by showing how many clicks and impressions your website had.
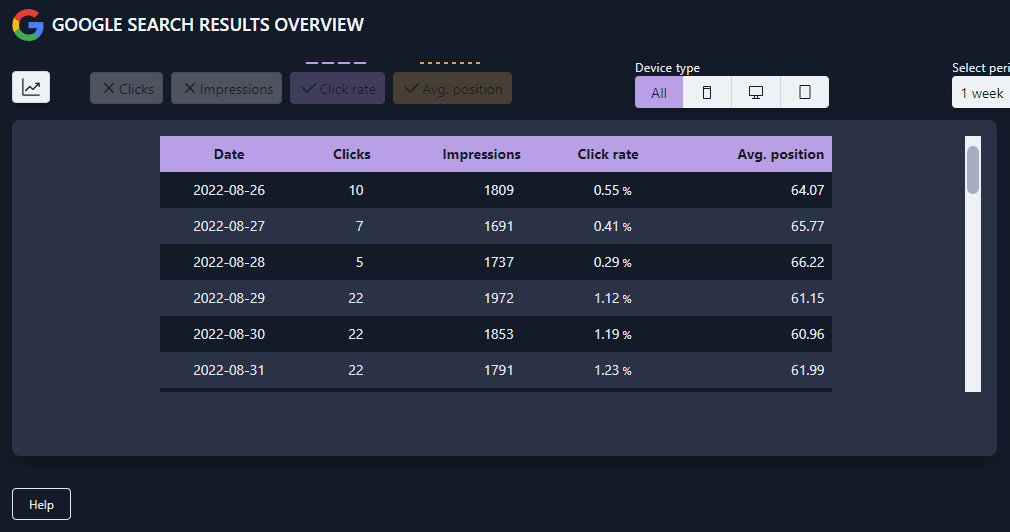
Display data as a table instead of a chart
Click the Table icon to the left of the chart to show the same data as a table instead of a graph. Click again to go back to the chart display:
The keywords dashboard report
Gives you a quick overview of the keywords people were searching for when Google chose pages of your website as possible responses.
Interactivity
You can click the various buttons displayed to:
- chose which data is displayed:
- Number of clicks
- Number of impressions: how many times a page from your website was displayed in Google search results
- Click rate: how many clicks per page displayed
-
Average position: in which position your website page was displayed on average.
-
Restrict the graph per device type: all, desktop only, mobile only, tablets only
-
Select a period the data should cover: 1 week, 1 months, 3 months, 1 year and 16 months (16 months is the longest period Search Console keeps data)
These buttons will change the dataset for both the dashboard chart and the dashboard keywords report.
Google updates
Google constantly updates their search algorithm and often inform the SEO crowd of what they are doing. Changes in Google's algorithms may be the cause of changes in your website search performance and so 4SEO overlays over all charts it creates the list of Google updates.
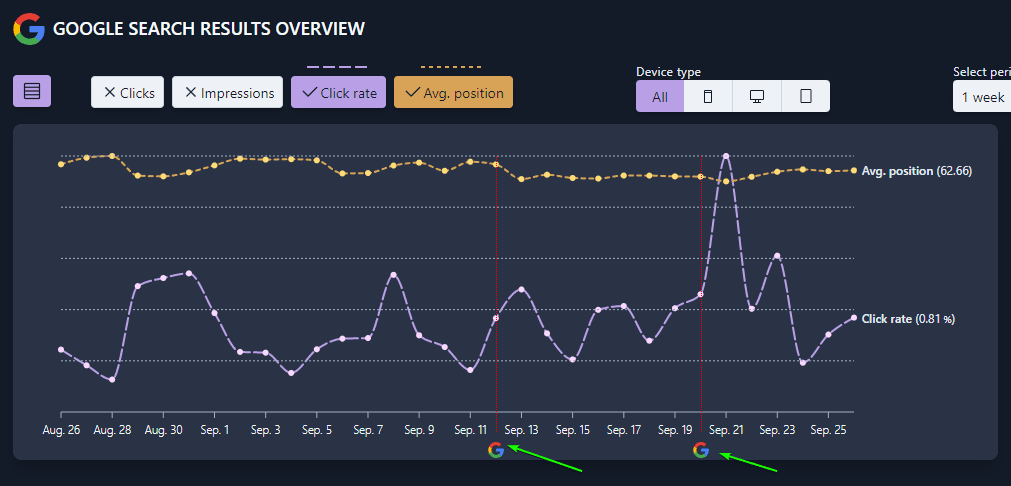
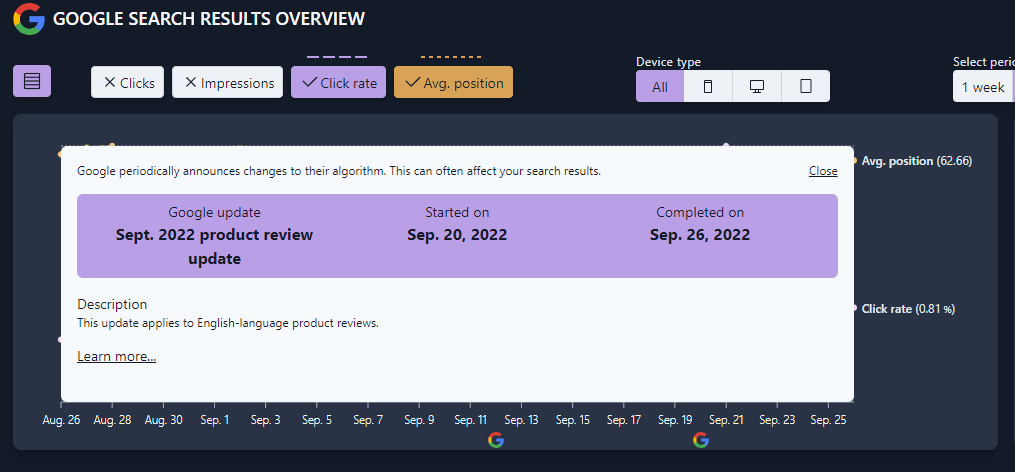
Each update is marked with a red dotted lines and the Google logo. Clicking on the log opens some details about the update, with a link to learn more about what Google did in that particular update.
Data freshness
To avoid getting over Google Search Console access quota, the base data obtained from Google is cached on your server for a few hours. This allows faster display as well.
The date and time at which the data you see have been retrieved is displayed below or next to each graph or data table:
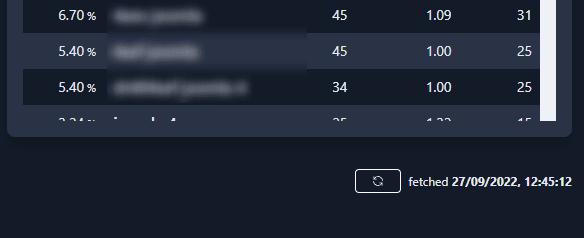
Click on the small Refresh icon to force 4SEO to retrieve the latest data from Google Search Console. This is normally not needed as Google does not update the Search Console data often, at most once a day.